
Table of Contents
Can I do optimization with low traffic? You have little traffic to your website. It’s no excuse for not trying to improve what you have.
How much traffic do I need to optimize my website?
If you really want to have a continuous optimization campaign, with several A/B tests per month, you will have to have 100,000+ hits/month.
From that amount of traffic, you should dedicate a monthly investment (in tools and equipment) to the optimization of your conversion; you’ll get interesting results and improve your performance.
An example, for a test with 2 versions, where the conversion is 3% and you want to improve by 20% (going from 3% to 3.6% conversion rates) with 95% confidence:
- Duration of 26 days if you have 1,000 visits a day.
- 8 days duration if you have 3,300 visits a day.

Source: https://vwo.com/tools/ab-test-duration-calculator/

Source: https://vwo.com/tools/ab-test-duration-calculator/
But don’t worry if you don’t have a lot of traffic to your website; you can still optimize your conversion rate…
Optimizing loading time
According to Google,a half-second delay could cause a 20% traffic loss.
From Google’s perspective, pages that take a long time to load will cause search engine robots to be unable to crawl as many pages, making Google unable to crawl effectively. This could have a negative effect on the organic performance of your website.
In addition, Google’s algorithm officially takes into account the overall speed of the website and the loading time of the page, which makes optimizing the speed of the page vital if you want to have a chance to get a higher position in the SERPs.
As a conclusion, optimizing the loading time of your website will allow you to improve the conversion rate, SEO and user satisfaction.
Low-traffic optimization tasks
Optimization depends on people, not just data; if the data isn’t there, people will give you important data: start with qualitative research. You can always do user testing, heuristic analysis, and customer interviews, even if you don’t have traffic.
User testing
User tests let you see and hear how real people representing your target audience interact with your website and comment on their thinking process aloud.
The idea is simple: observe how real people use and interact with your website while commenting on their thought process aloud. You will pay attention to what they say and their experience.
User tests give you direct information about how real users use your website. You may have designed what you think is the best user experience in the world; but watching real people interact with your site is often an experience that can be humiliating. Because you’re not your user.
You can do this in person or remotely. When you do them in person, you’re going to test the users, make sure you film everything. Doing it remotely by using online user testing tools is definitely the cheapest and fastest way to do it.
Heat Maps / Click Maps
A heat map is a graphical representation that uses a color coding system to represent different values. Heat maps are used in various forms of analysis, but are most commonly used to display user behavior on specific web pages.

Thanks to tools like Hotjar you can start to get data about the behavior of your users.

Don’t forget to analyze heat and click maps, as well as session recordings for both computer traffic and mobile traffic.
For more information on analyzing heat maps, there is an excellent article in Hubspot.
Surveys
Try to get answers from your visitors, either while they’re browsing or when they’re leaving, with a simple question to understand their doubts and identify points of friction you might have overlooked.
A survey sent to your customers after conversion, allowing them to evaluate their experience, will reveal anything that can be improved or reinforced.

Heuristic analysis
Heuristic analysis is an analysis of your site and your tools based on expert advice and an analysis of experience from the perspective of industry standards and best practices. This type of approach uses, among other things, usability concepts such as those presented by Jakob Nielsen:
- System status visibility (where am I on the site?)
- Match between the system and the real world.
- User control and freedom
- Consistency and standards (normalization)
- Error prevention
- Recognition rather than remembering
- Flexibility and efficiency of use.
- Aesthetic and minimalist design.
- Helps users recognize, diagnose, and recover from errors
- Help and documentation
Analytics Audit
An audit of your Google Analytics account is often the first step needed to improve your organization’s analytical maturity. If you can’t trust your data, you won’t be able to make decisions.
It’s key to dedicate time and resources to your analytics audit; in our blog we leave you an article on Google Analytics Auditing in 45 steps
Performing a Google Analytics audit will allow you to answer several questions:
- Does my account recompile the data I need?
- Can I trust the data presented to me by Google Analytics?
- What are the configuration errors?
- Are there elements that could be improved?
- What reports do I need?
The data analysis job is based on trust in the data. Google Analytics aims to guide action and plays an important role in decision-making. Data must be reliable, secure.
The primary goal of auditing your Google Analytics account is to help ensure the integrity and quality of your data. Correcting what is causing problems, improving what can be improved.
Events in Analytics
If you haven’t already, it’s highly recommended to create custom events with Google Analytics (or even better with Tag Manager).
By default, your Analytics account doesn’t give you the ability to track events like clicks on outgoing links, forms, sharing button clicks, and more events specific to your website.
Obtaining data about these events will allow you to know the actions your users do; if buyers click on your size information link, if those who don’t buy sign up for your newsletter or visit certain links.

Funnel analysis
Perform an analysis of your funnel: where do your visitors leave?
A funnel is an idea or way to visualize and understand the flow and conversion of leads to customers who buy.
And these visitors can be generated through a variety of methods like SEO, content marketing, social media marketing, paid ads and even other methods.
If you can understand and analyze the process, you can take steps to improve that flow.

This is a very simple visualization that shows the four main steps of the process:
First, your lead realizes your existence or your product. (Awareness)
Second, you generate interest in your product. Note that the funnel becomes smaller because not everyone who knows your product will be interested. (Interest)
Third, you must plant the seed of desire for your product or service. Again, the funnel gets smaller because you can’t expect everyone interested to really want your product. (Desire)
And finally, you ask for action. For example, the action might be to buy something or subscribe to an email list. This is the smallest part of the funnel because only a small percentage of the original leads will take action. (Action)
There are many who question that model and claim that the real-life funnel can never be so linear. However, from a conversion optimization point of view with little traffic, it’s a method that can help you.

Test A/B: Microconversions
What is a microconversion?
A microconversion is a small step on a visitor’s path to their primary conversion goal (usually called macroconversion). For most websites, these macroconversions are a purchase.
The closer your test starts to the start of the funnel, the higher the number of users and, in general, the higher the conversion rate, which will help the test performance.
Low-traffic optimization is finding those important microconversions and improving them.
“Add to cart” is an example of a microconversion, compared to “Proceed to payment”, which is a macro conversion and one of the main business objectives of the web.
Normally, you’ll get a lot more clicks on the “Add to Cart” button than actual purchases, allowing you to perform more meaningful tests faster and faster.
It’s true that adding an item to your cart isn’t the same as a purchase, but by optimizing this step in the purchase process, you increase the likelihood of a positive impact on your final sales conversion.
Test A/B: Try radical things
If you’re low on traffic, you need to do high-impact A/B tests (radical changes).
Taking an A/B test with a slight text change (see example), it’s not recommended when you don’t enjoy tens of thousands of visits.
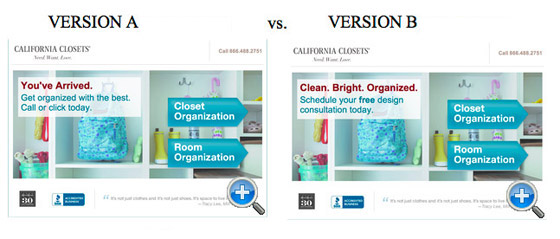
Source: https://vwo.com
In order for an A/B test to give you useful results and with less time, you’ll have to try very different things. Changes page structure, main colors, amount of text, and images,… change what you think is important and that is very different from the original.

Source: https://vwo.com
As you can see, there are numerous very interesting and effective tasks to get started with low traffic optimization.
Once you have more visitors, you will be able to do faster analyses and more numerous tests.
Never stop getting better.
